|
Pickerel 56-0475-00
|
|
Lake Information
MN Lake ID: 56-0475-00
County: Otter Tail
Ecoregion: NCHF
Major Drainage Basin: RD
Latitude/Longitude: 46.42777778 / -95.80305556
Years Monitored: 1996 - 2026
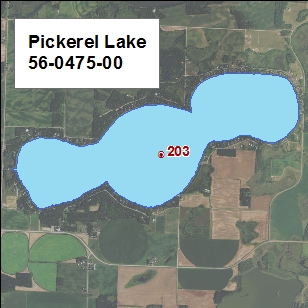
Monitored Sites: 100,203
|
Physical Characteristics
Surface area (acres): 829
Littoral area (acres): 274
% Littoral area:
Max depth (ft): 79
Max depth (m):
Mean depth (ft): N/A
Watershed size (acres): N/A
Aquatic Invasive Species: Zebra mussel
|
MPCA Assessment Report
Search County Monthly Precipitation Data
MN DNR Watershed Health Assessment Framework
|
View MN DNR Fisheries Report
View MN DNR Lake Level Report
|
|
Water Quality Characteristics
(data from RMB monitoring database only)
|
|
Parameters
| Primary Site
203
| Site
100
|
|
|
|
|
Total Phosphorus Mean:
| 13.4 | 73 |
|
Total Phosphorus Min:
| 2.5 | 18 |
|
Total Phosphorus Max:
| 29 | 124 |
Number of Observations:
| 144 | 4 |
|
|
|
Chlorophyll-a Mean:
| 5.2 | 4.8 |
Chlorophyll-a Min:
| 0.5 | 2 |
Chlorophyll-a Max:
| 23 | 8 |
Number of Observations:
| 144 | 4 |
|
|
|
Secchi Depth Mean:
| 11.8 | |
Secchi Depth Min:
| 4 | |
Secchi Depth Max:
| 21.5 | |
|
Number of Observations:
| 141 | 0 |
|
|
|
|
Trophic State Index Mean:
| 42.3 | |
Trophic State: Mesotrophic
|
|
|
Trends
For detecting trends, a minimum of 8-10 years of data with four or more readings per season is recommended by the Minnesota
Pollution Control Agency.
Where data does not meet these criteria, trends can be misidentified because there are many factors that affect water quality naturally.
Trend analysis does not take into consideration aquatic invasive species. Species like zebra mussels can alter water chemistry over time.
The data was analyzed using the Mann Kendall statistical analysis. Primary site only.
Years Monitored: 1996 - 2026
Total Phosphorus: No significant trend exists.
Chlorophyll-a: No significant trend exists.
Secchi Depth: No significant trend exists.
Trophic State Index: No significant trend exists.
|
Ecoregion Comparisons
Minnesota is divided into seven ecoregions based on land use, vegetation, precipitation, and geology. The MPCA has developed average ranges of water quality expected for lakes in each ecoregion. Comparisons are based on interquartile range, 25th-75th percentile, for ecoregion reference lakes. Primary site only.
Ecoregion: NCHF
Total phosphorus: Better Than Expected Range
Chlorophyll-a: Within Expected Range
Secchi depth: Better Than Expected Range
|

RMB Environmental Laboratories, Inc. • 218-846-1465 • lakes@rmbel.com • www.rmbel.com